We tailor data, information and applications to the workplaces, roles and tasks in your die casting foundry. Panel Applications provide current, contextualised data and status information directly at the workplace. Board Applications combine an overview of the current status with further aggregations. Platform Applications also make years of collected data available for detailed analysis across sites.
Panels provide process information, documents and manual quality inspection functions at an individual workplace, for example at the machine or inspection station. Applications are configured for the specific task and direct use by employees.
Touch operation and an intuitive UI for use on site
Use process values, documents and inspections in everyday workflows
Tailor functions and configuration to the workplace
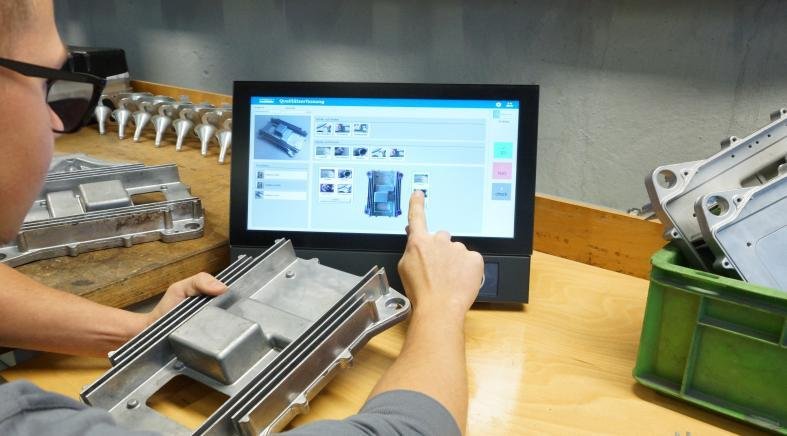
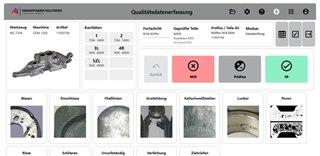
Q-Panel light
Record manual visual inspections in a structured way: OK, check or not OK, cavities and illustrated defect categories. Continue inspections locally and archive them.
How it helps
Guide inspections by cavity and defect type → standardise data recording
Document OK, check and not OK results → record anomalies
Continue and archive inspections locally → stay within the workflow
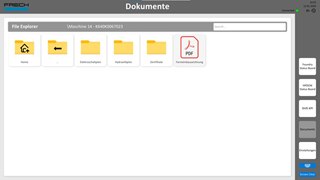
Documents Management
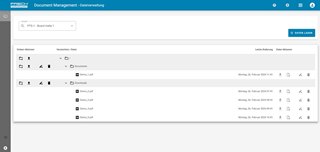
Use local PDF documents directly at the workplace with folders, search, zoom and touch operation.
How it helps
Find and open documents locally → use information at the workplace
Zoom and touch operation → improve readability in the application
Use a folder structure → find the documents you need faster
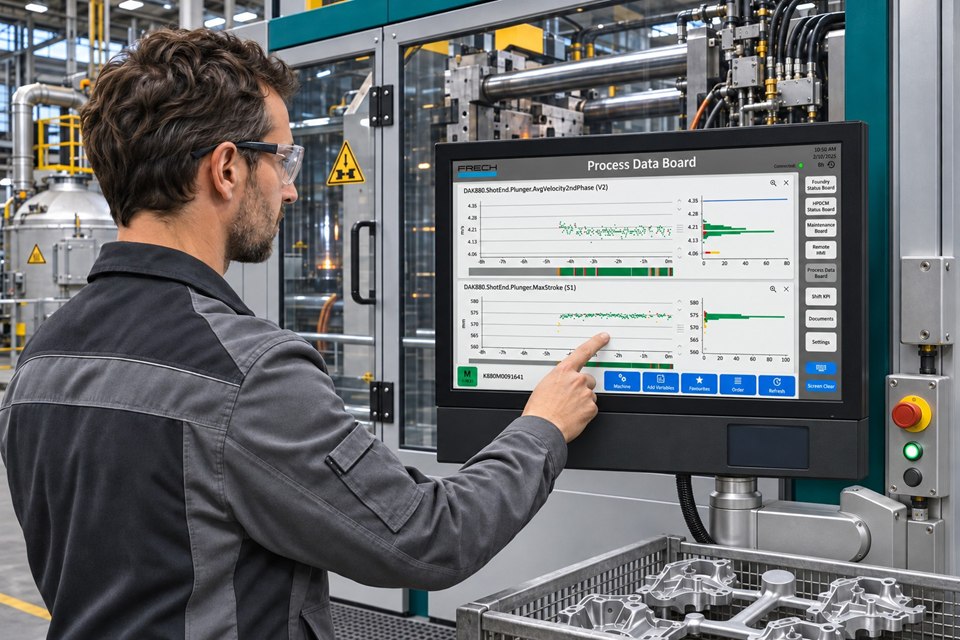
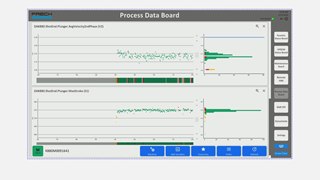
Process Data Board
View process values for a configured machine using trends, histograms and tolerance limits. Set your own favourites.
How it helps
View trends directly at the machine → identify changes
Use histograms and tolerances → assess variation
Set favourites → quickly find relevant variables again
Board Applications
Bring information together at key locations
Boards bring relevant production information together at central or important shop floor locations, such as meeting points or production areas. Teams gain a shared overview of machines, states and key figures. Passive status boards or interactive information points are deployed to suit local information needs.
Overview and machine details at a glance
Make process data and shift KPIs visible
Use as passive status boards or interactive information points
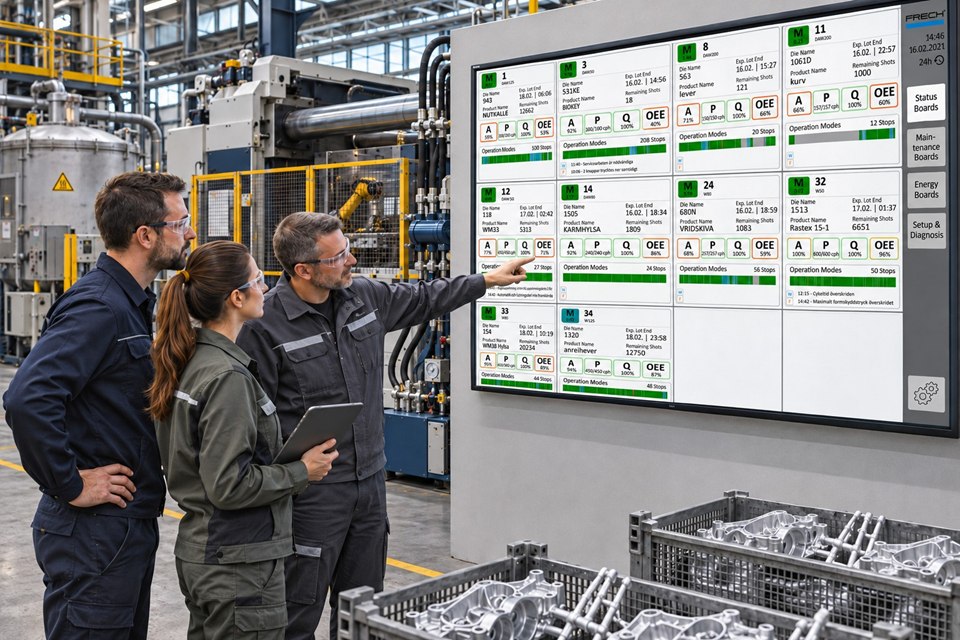
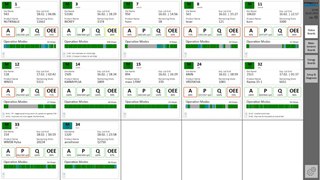
Foundry Status Board
See states, KPIs and current messages for several die casting machines at a glance.
How it helps
Display several machines together → understand the production situation
Combine status information and messages → locate anomalies
Make information visible on the shop floor → support a timely response
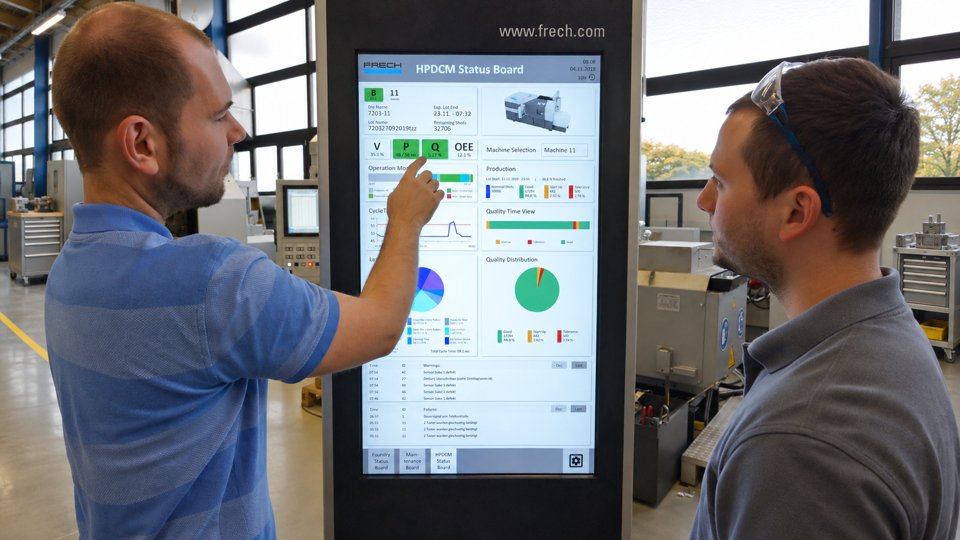
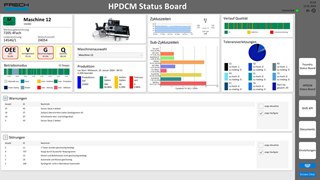
HPDCM Status Board
Examine one die casting machine or cell in detail: lot, cycle times, subcycle times, quality and messages.
How it helps
Examine a machine in detail → understand the current situation
Connect lot and subcycle data → identify time losses
Include quality and messages → reveal relationships
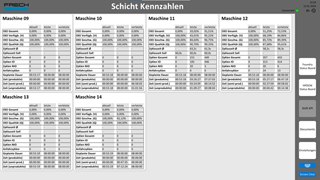
Shift KPI
Compare selected machine KPIs across current and previous shifts.
How it helps
Organise KPIs by shift → compare the relevant periods
Review current and previous shifts → identify trends
Group selected machines → support team discussions
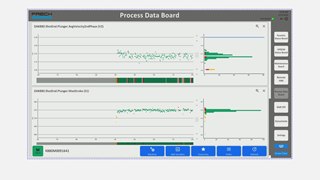
Process Data Board
View process values on the board using trends, tolerance limits and histograms. Investigate relevant changes together as a team.
How it helps
Review process variables and tolerances → detect deviations
Use histograms → examine distributions
Review process trends together → interpret changes as a team
Documents Management
Provide PDF documents directly on the board. At interactive information points, users can access documents through folders and search and use zoom and touch controls.
How it helps
Provide documents on the board → share information on site
Open documents through folders and search → find the content you need faster
Use zoom and touch controls → examine details at the information point
Platform Applications
Gain an overview and put extensive data to work
Platform Applications give you access to current data and years of historical data from your die casting foundry. From an overview across sites to detailed investigations of machines, tools and processes, the same connected data foundation supports different use cases, such as productivity, quality, energy consumption and technical root cause analysis.
Consider current states and long-term trends in context
Analyse extensive data by machine, tool, lot and period
Tailor applications and analysis depth to different tasks and roles
Foundry Cockpit
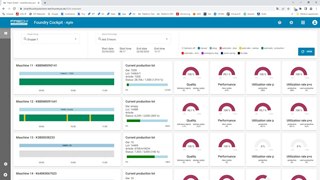
View the status of connected production worldwide. See machine states, production lots and KPIs in one overview. Select groups, periods and refresh settings to suit the task.
How it helps
Bring together the states of several machines → detect anomalies sooner
Move from overview to detail → identify affected equipment
Shared information → make team coordination easier
Production Intelligence Boards
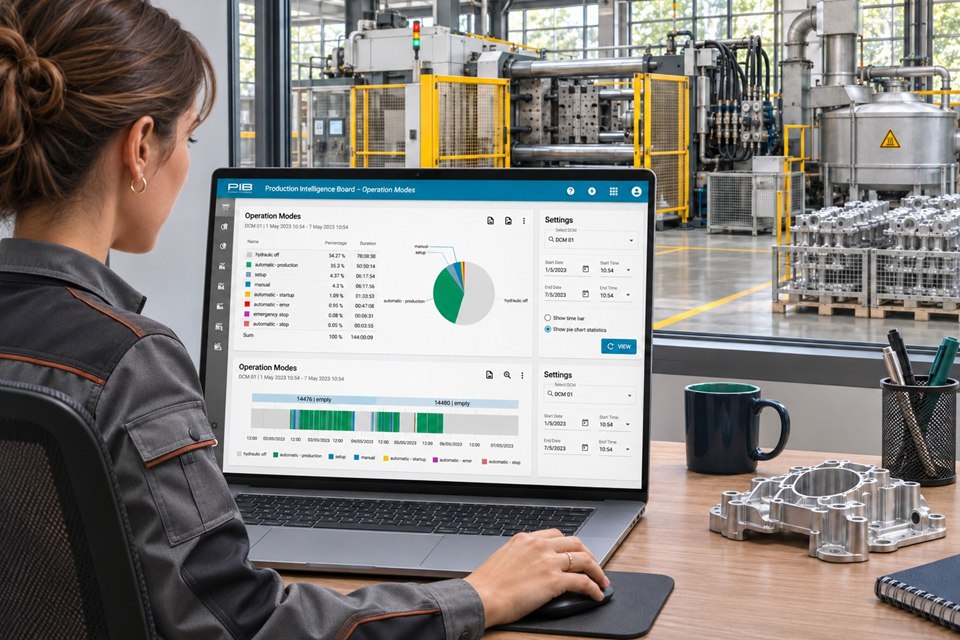
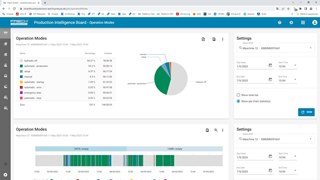
Analyse operating modes, warnings, faults and KPIs by machine, tool or lot. Use Advanced Metrics to assess energy, costs and energy-related emissions as well.
How it helps
Analyse operating modes and messages → identify the main sources of loss
Filter machines, tools and lots → narrow down relationships
Compare KPIs → target improvements more precisely
Link measurements to cost and emission factors → assess resource consumption in process context
Production Transparency Tool
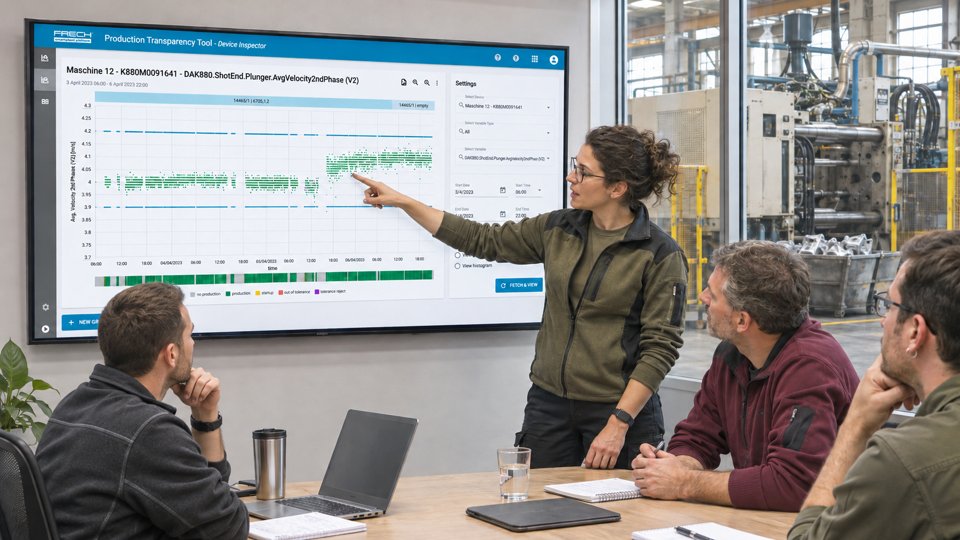
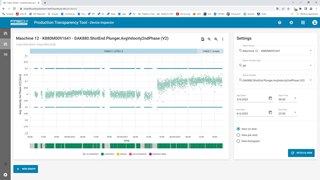
Compare machine, process and sensor data by time or cycle. Examine lots, distributions and individual trends in more detail.
How it helps
Connect time and cycle perspectives → understand process changes
Compare distributions and individual trends → investigate causes
Use tool and lot context → find the right basis for comparison
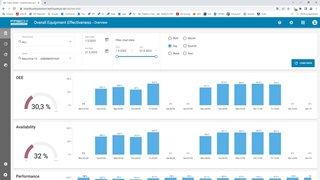
OEE Agent
Analyse availability, performance and quality separately. Align calculation rules and reporting periods with your operational assessment.
How it helps
Separate availability, performance and quality → attribute losses
Align calculation rules → interpret KPIs in operational context
Compare periods → make trends visible
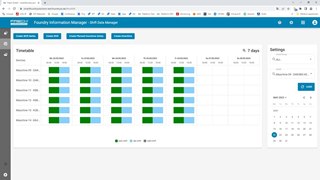
Foundry Information Manager
Maintain shifts, planned downtime, machine and tool groups, and calculation parameters.
How it helps
Maintain shifts and downtime periods → structure analyses
Create machine and tool groups → make comparisons easier
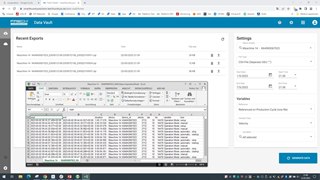
View statistics about your data holdings and export primary data for further processing. Select messages, operating modes and process data for additional analyses.
How it helps
View data inventory statistics → understand volume and composition
Select primary data → compile the right data for the question
Export primary data → process and analyse it in other tools
Reporting
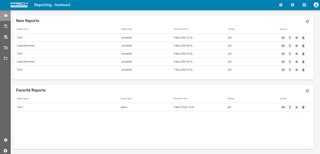
Create, archive and distribute reports on demand or on a recurring basis. Use tables, text and charts for recurring evaluations.
Organise files and folders centrally and make them available on panels and boards. The documents you need are accessible on site in a suitable folder structure.
How it helps
Organise files and folders centrally → give documents a clear structure
Provide content on panels and boards → make documents available on site
Use a suitable folder structure → find the required documents faster
Guards
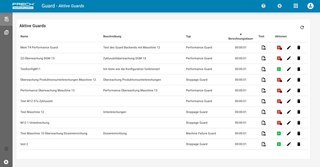
Monitor performance, downtime and machine faults with configurable rules. Notify the responsible people or groups by email.